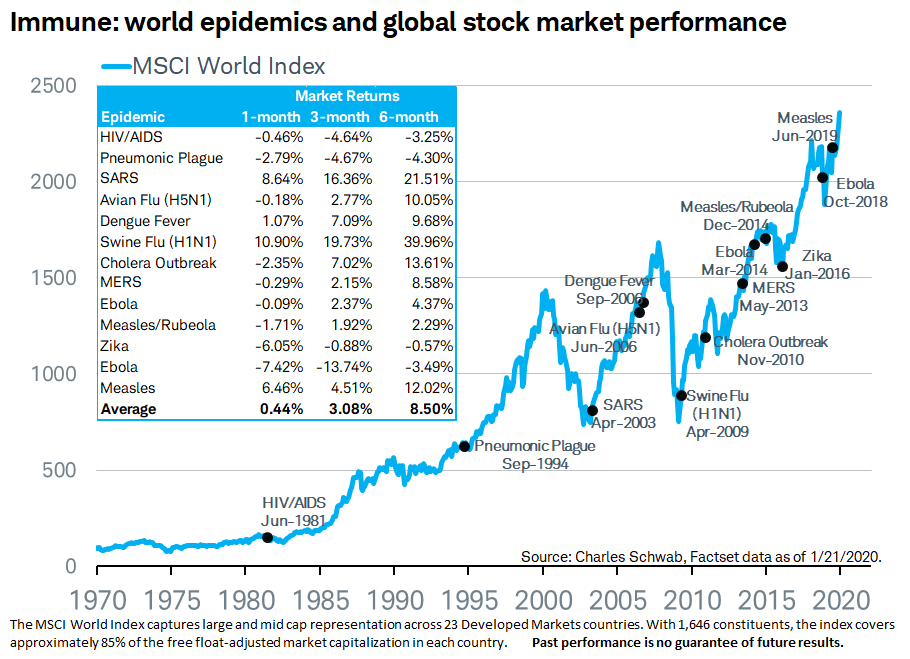
• About Us
  • InVEST Risk Model
  • Blog
  • Client Login

TJT Capital Group, LLC

Asset management, money management, investment management, risk management, Stamford, CT

  • About Us
  • InVEST Risk Model
  • Blog
  • Client Login

December 2019 Insights

December 3, 2019

The U.S. equity markets recorded all-time highs in November as momentum from trade deal optimism along with a liquidity injection from the Federal Reserve boosted risk assets. In addition, some money that had moved out of equities on concerns about an economic recession and the impeachment inquiry came back in, and some hedge funds that had bet against the market were forced to cover their short positions.

On October 11, 2019 President Trump announced a partial trade deal with China saying ”we have come to a very substantial phase one deal.” On October 13, 2019, President Trump tweeted “My deal with China is that they will IMMEDIATELY start buying very large quantities of our Agricultural Product, not wait until the deal is signed over the next 3 or 4 weeks.”

The “deal” announced in October was supposed to have been signed in November. Yet on December 3, 2019, President Trump said at a NATO summit “in some ways, I think it’s better to wait until after the election” to do a deal with China.

Click here to read the full report.


Balance Sheet Normalization

November 13, 2019

On October 11, 2019, in response to overnight lending rates surging due to extremely tight liquidity, the Federal Reserve announced it will be purchasing 60 billion dollars of Treasury bills per month at least into the second quarter of next year in order to maintain ample reserve balances.  This was the first time since 2014 the Fed’s balance sheet is intentionally growing.  While the Fed points out that this “Balance Sheet Normalization” is required to address the need for additional reserves in the system and not technically “QE” (quantitative easing), it nonetheless is adding additional liquidity to the system.

Click Here to learn why this is important when managing your money and what else is On Our Radar.


November 2019 Insights

November 5, 2019

The S&P 500 index gained 2 percent in October and recorded an all-time high as the Federal Reserve cut interest rates and progress was reportedly made on the ongoing trade war with China. After exceeding the 3000 level in July and again in September – only to be followed by sharp declines – the S&P 500 broke through for the third time and took out the July high of 3025.86 to close at 3037.56 on October 31, 2019.

Click here to read the full report.


Unemployment Rate

October 9, 2019

The Unemployment Rate is a subcomponent in the Economic cycle indicator in TJT’s proprietary InVEST Risk Model®.

U.S. unemployment hit a 50-year low in September.  The jobless rate dropped to 3.5% in September from 3.7% in August, marking the lowest rate since December 1969.

Contact us to learn why this is important when managing your money.

October 2019 Insights

October 3, 2019

The S&P 500 index gained 1.7 percent in September despite headwinds from slowing global growth, the ongoing trade war with China, rising geopolitical tensions in the Middle East, and the new impeachment inquiry into President Trump. The S&P 500 closed out September at 2976.74, compared to 2980.38 at the end of July and 2913.98 on September 30, 2018.

Since the Federal Reserve initially cut interest rates on July 31, 2019, the S&P 500 was roughly flat at the end of September, and had gained 2.3 percent over the previous twelve months. Clearly the trade tensions have had a lot to do with that, and it has been an exhausting exercise. One day President Trump bashes China at the United Nations General Assembly, and literally the next day he says a deal with China “could happen sooner than you think.”

President Trump’s supporters suggest his version of “3-D chess”- a complicated negotiating game that works to his advantage – is helping, while his detractors say it is an indication of an ad hoc policy that changes depending on what the markets are doing at that time.

Click here to read the full report.

September 2019 Insights

September 3, 2019

On August 31, 2018, the S&P 500 index closed at 2901.52. One year later, on August 31, 2019, the S&P 500 stood at 2926.46, a gain of 0.85 percent with some significant swings in volatility along the way.

On July 31, 2019, the Federal Open Market Committee (FOMC) cut interest rates for the first time following nine rate hikes between 2015 and 2018. The S&P 500 was 2980.38 at that time. Over the next few weeks the S&P 500 had three daily declines that were greater than 2.5 percent, and it closed down 1.8 percent in the month of August. Clearly there is a lot going on, and interest rate cuts are not a panacea.

The ongoing trade war, questionable Federal Reserve policy, slowing global growth, drastic currency moves, and an economic crisis in Argentina are but a few of the major issues weighing on the markets.

Click here to read the full report.

Conference Board Leading Economic Index (LEI)

August 22, 2019

The Conference Board Leading Economic Index (LEI) is a subcomponent in the Economic cycle indicator in TJT’s proprietary InVEST Risk Model®.

The LEI for the U.S. increased 0.5 percent in July to 112.2, following a 0.1 percent decline in June, and a 0.1 percent decline in May.  In the six-month period ending in July, the LEI increased 0.8 percent.

Contact us to learn why this is important when managing your money.


August 2019 Insights

August 2, 2019

The S&P 500 index gained 1.3 percent in July and recorded its first close above the 3000 level in history, however, the index fell 1.5 percent in the last few days of the month as the Federal Reserve cut interest rates for the first time since 2008.

Click here to read the full report.

Mutual Fund and ETF Flows

July 25, 2019

Mutual fund and ETF flows are a subcomponent in the Sentiment indicator in TJT’s proprietary InVEST Risk Model®.

Contact us to learn why this is important when managing your money.

Click HERE to read the WSJ article.


  • « Previous Page
  • 1
  • …
  • 7
  • 8
  • 9
  • 10
  • 11
  • …
  • 13
  • Next Page »

On Our Radar Highlights. When It Mattered Most

Download PDF

Contact Us

9 W. Broad St
Stamford, CT 06902
(p) (877) 282-4609
(f) (203) 504-8849
info@tjtcapital.com

Social Links

  • Facebook
  • LinkedIn
  • Twitter

Important Disclosures

  • Disclosure Information
  • Privacy Policy
  • Firm Brochure
  • Form CRS

More Resources

  • Fed’s Response to Crisis
  • Fed Aftermath of Crisis
  • Psychology of Investing
    • Price Matters
Copyright © 2025 TJT Capital Group. All rights reserved.
Site By Objectiv